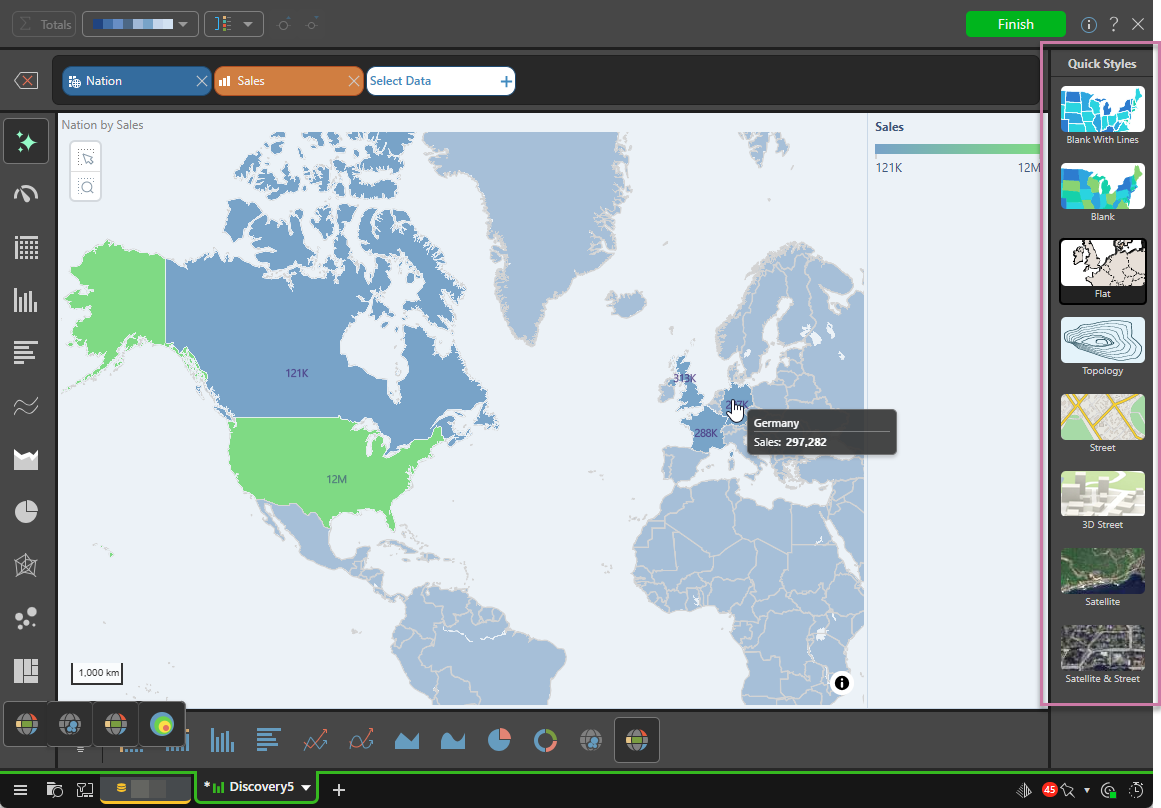
The quick style presets are supported for different types of Maps. These presets (purple highlight below) let you apply a pre-designed selection of formatting options to the given chart.
Map Types
The following table shows which "map types" are supported for which maps. Click the map type name to see an example of each given type.
|
Map type |
Bubble Maps? |
Geo Heat Maps? |
Shape Maps? |
Layered Maps? |
|---|---|---|---|---|
|
Yes |
Yes |
Yes |
Yes |
|
|
No |
No |
Yes |
Yes |
|
|
No |
No |
Yes |
Yes |
|
|
Yes |
Yes |
Yes |
Yes |
|
|
Yes |
Yes |
Yes |
Yes |
|
|
Yes |
Yes |
Yes |
Yes |
|
|
Yes |
Yes |
Yes |
Yes |
|
|
Yes |
Yes |
Yes |
Yes |
Flat
- Show outline map, with borders but no contours.
Blank
The blank map is only available for Shape Maps and Layered Maps:
- For Shape maps, the blank map only displays shapes and data only includes the entities for which data is available. Data labels are enabled by default (values are shown); you can also show percentages, and captions, or disable data labels.
- For Layered maps, the blank map only displays shapes and not data.
![]()
Blank with Lines
![]()
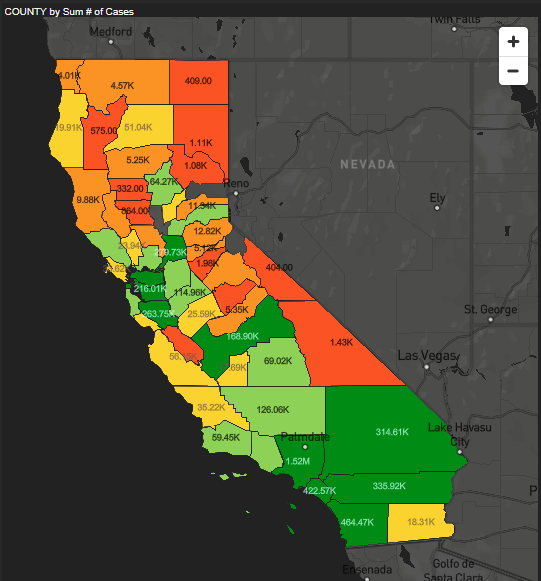
Topology
- Show borders and contours.
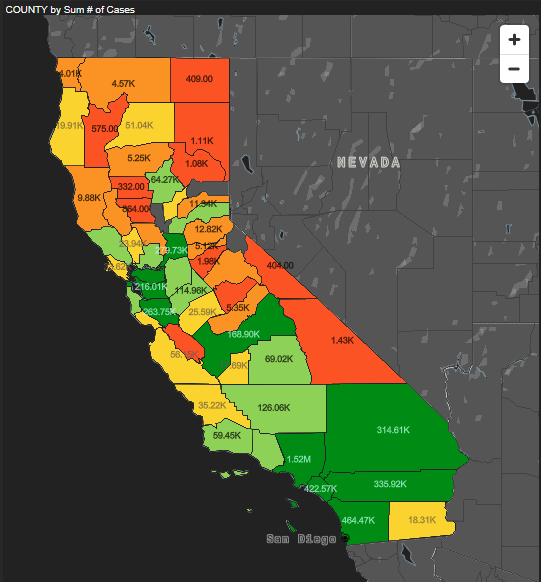
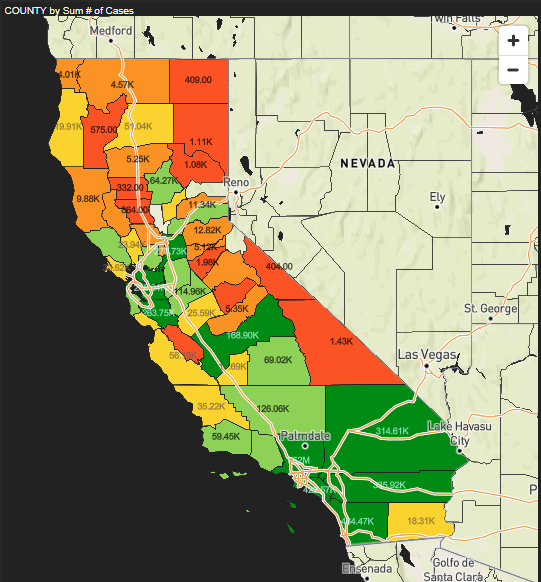
Street
- Show names and borders.
- Show colors to represent contours.
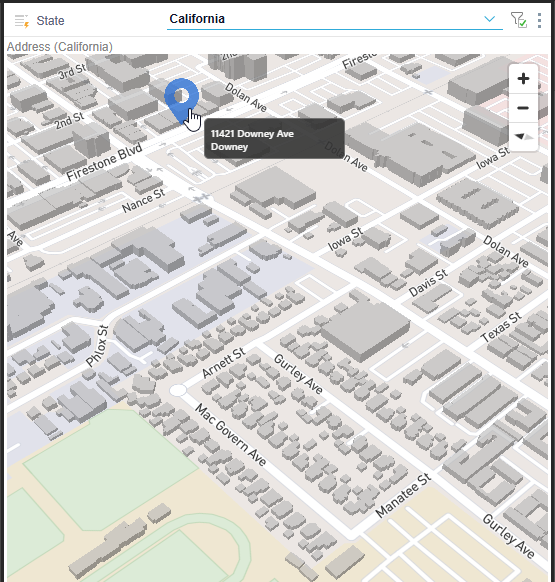
3D Street
3D Street is a street map that allows you to zoom in on and "fly around" the three-dimensional buildings on your map. You can "tilt" your map (pitching up) on the right-click and zoom in to see and explore the streets with 3D building models and (where it is a layered map) location markers. For more information, see Exploring 3D Street Maps.
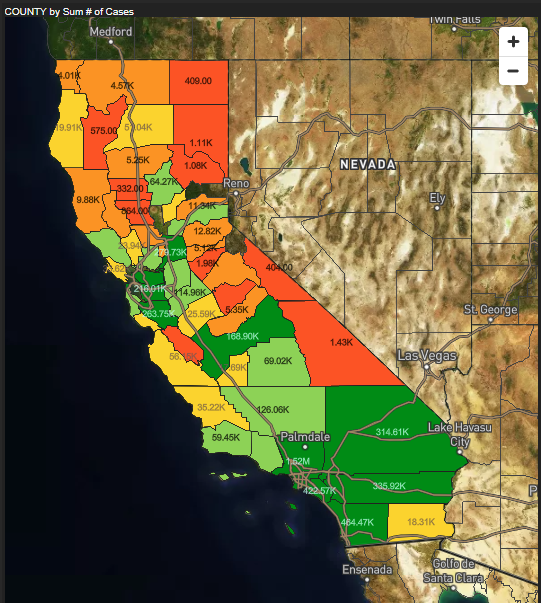
Satellite
- Display data in satellite view.
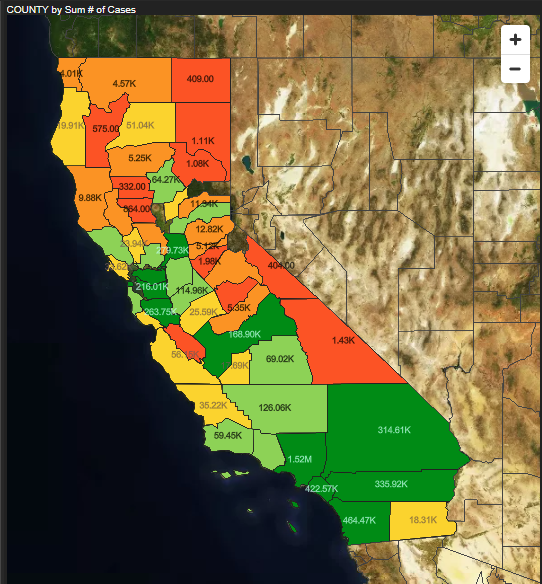
Satellite & Street
- Show satellite view.
- Display names and borders.